
Before I answer that question, let’s break down the numbers first.
The City of Windsor has one mayor and ten councillors, each of whom represent a ward. City Council generally meets twice a month.
Councillors sit on four standing committees that meets once a month. They are:
1. Corporate Services Standing Committee
2. Development & Heritage Standing Committee
3. Environment, Transportation & Public Safety Standing Committee
4. Community Services and Parks Standing Committee
There are a number of Advisory Committees that report to a designated Standing Committee. For example, the Advisory Committees reporting to the Community Services and Parks Standing Committee are:
- Community Public Art Committee
- Diversity Committee
- Mayor’s Youth Leadership Team
- Senior’s Advisory Committee
- Windsor Accessibility Advisory Committee
- Huron Lodge Committee of Management
- Housing Advisory Committee
The Agencies, Boards and Commissions reporting to the Community Services and Parks Standing Committee are:
- Windsor Public Library
- Windsor Essex County Health Unit
- Windsor-Essex Community Housing Corporation
- Roseland Golf Club Board of Directors
- Willistead Board of Directors
These committees do much important work. One of the reasons why I really appreciate my city councillor, Chris Holt, is that he regularly highlights the work of these groups and encourages residents to engage with them.
While the City of Windsor’s Open Data Portal has a spreadsheet of the contact information for the elected officials of the city, the membership of all of the advisory boards, agencies, committees and commissions are spread around the City of Windsor website. So I tried to bring the information together in a table.

Please note: my table is not complete. I don’t know who the reps are for the 9 BIAs in the city and I’m still looking for the membership lists of the following:
- Street and Alley Closing Committee
- Willistead Board of Directors
And then I turned the table above into a network / graph using the wonderful Graph Commons:
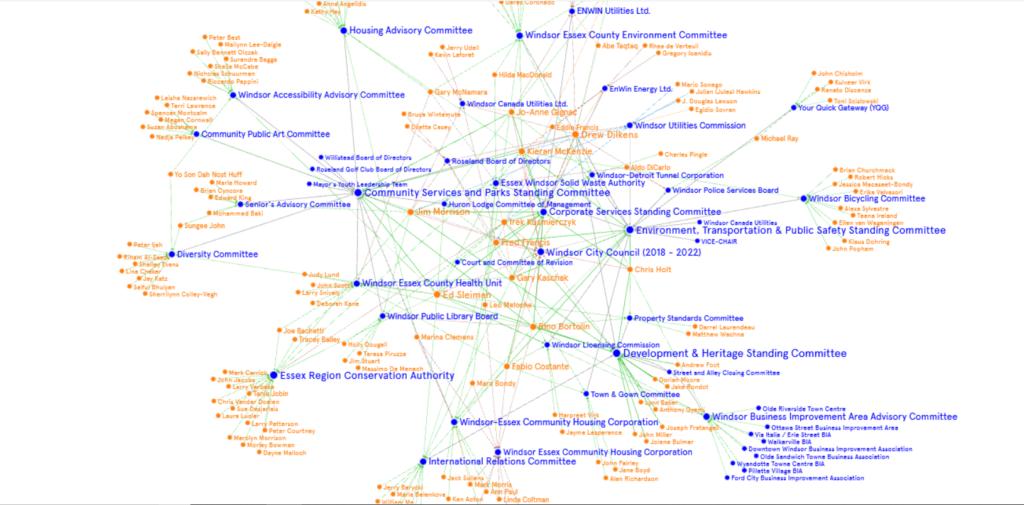
My goal of this graph was not to visually demonstrate board interlocks but to better represent the scope and the size of all the representatives of our city government.
And I also was curious about the gender make up of this collective.
At the moment, my table lists 43 organizations, which looks likes this:

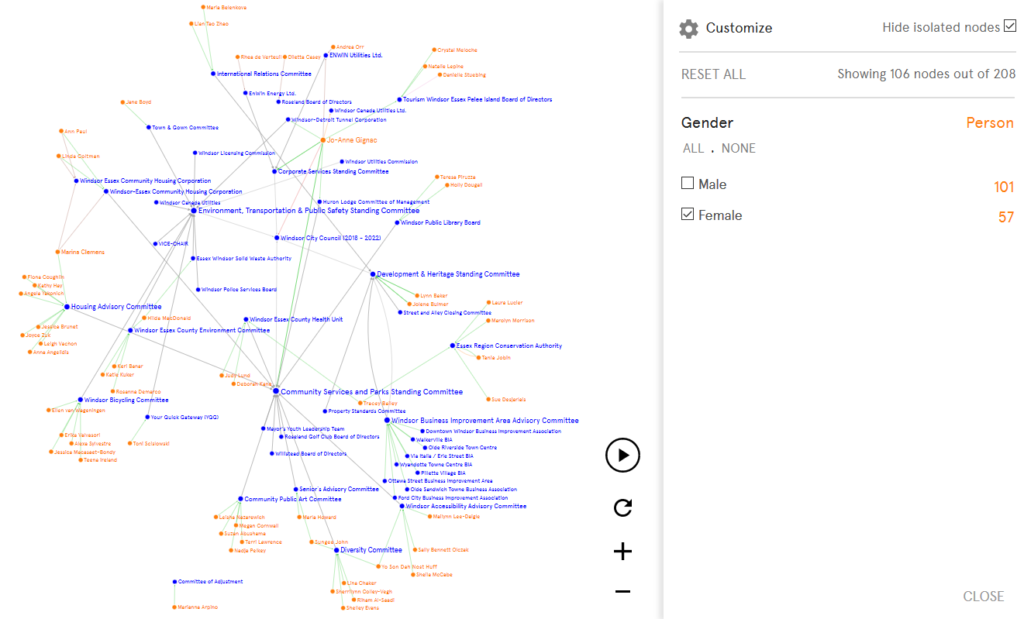
There are 158 people who are members of these organizations. 101 are male. 57 are female. That’s 36%.
If you use the filter option, you can select for gender and see which committees have the most women on them – the Community Public Art Committee, the Housing Advisory Committee and the Windsor Cycling Committee – and which committees have one woman or none.
And this is what the graph looks like of only men:
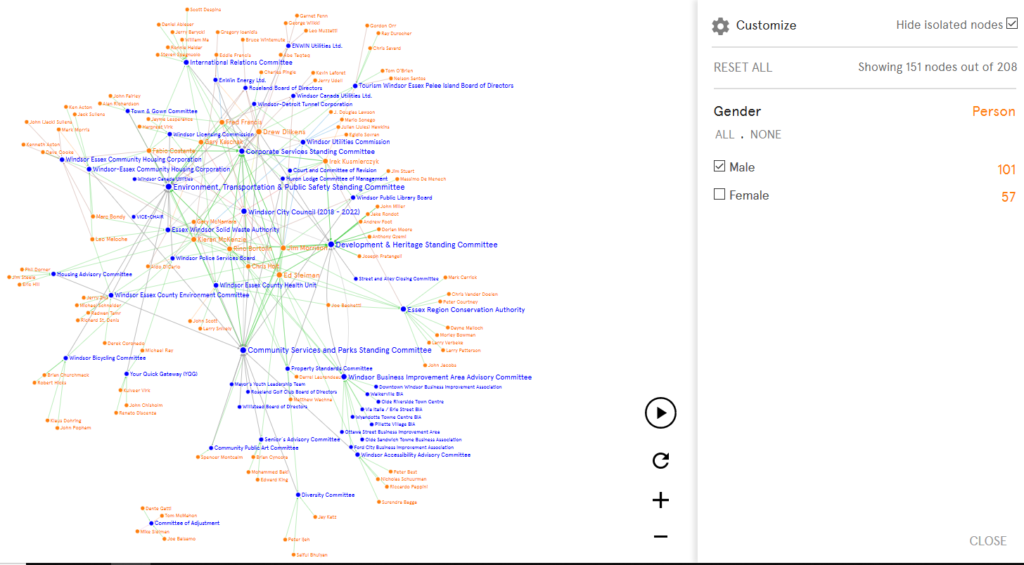
I would like to know the best way to suggest to council when they select for the next set of resident representatives they should do a better job in regards to gender parity on more boards.